What it produces
Defensible artefacts, not a dashboard
A dependency graph of your critical functions, scenario results with quantified recovery time and financial exposure, and a gap register mapped directly to DORA articles and the supporting RTS. Every figure is traceable to its source data.
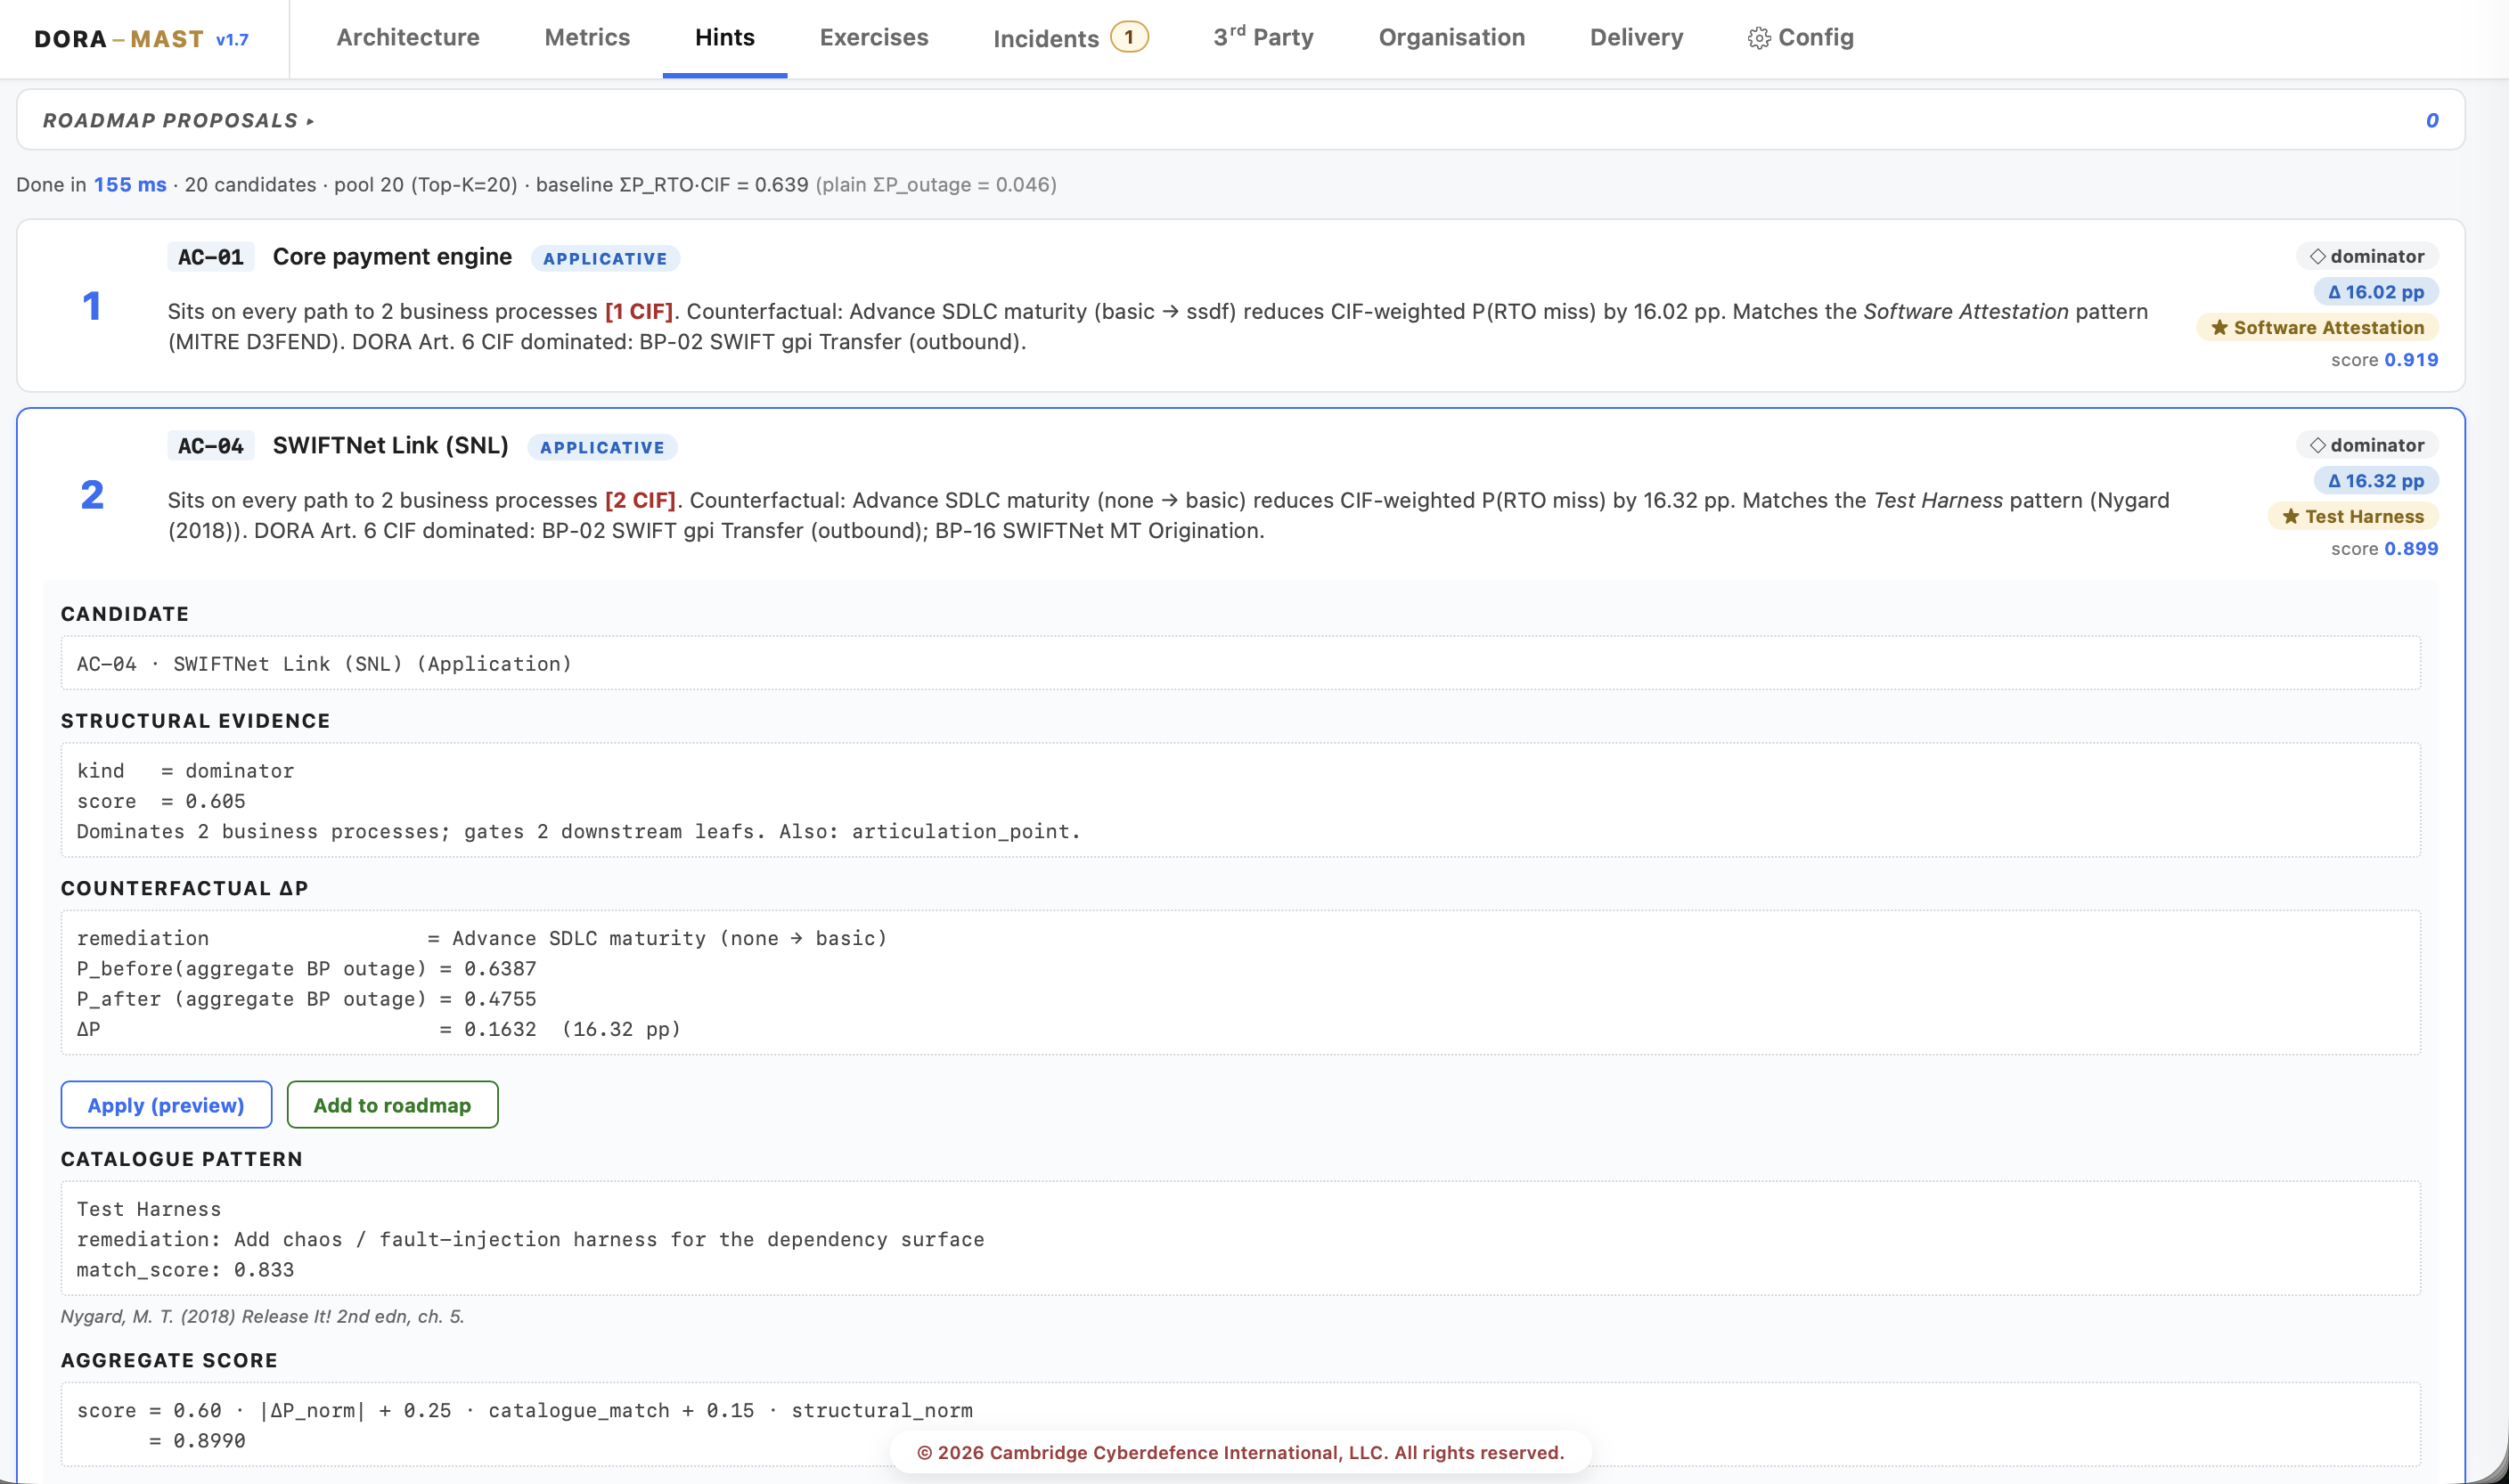
Computed, not asserted
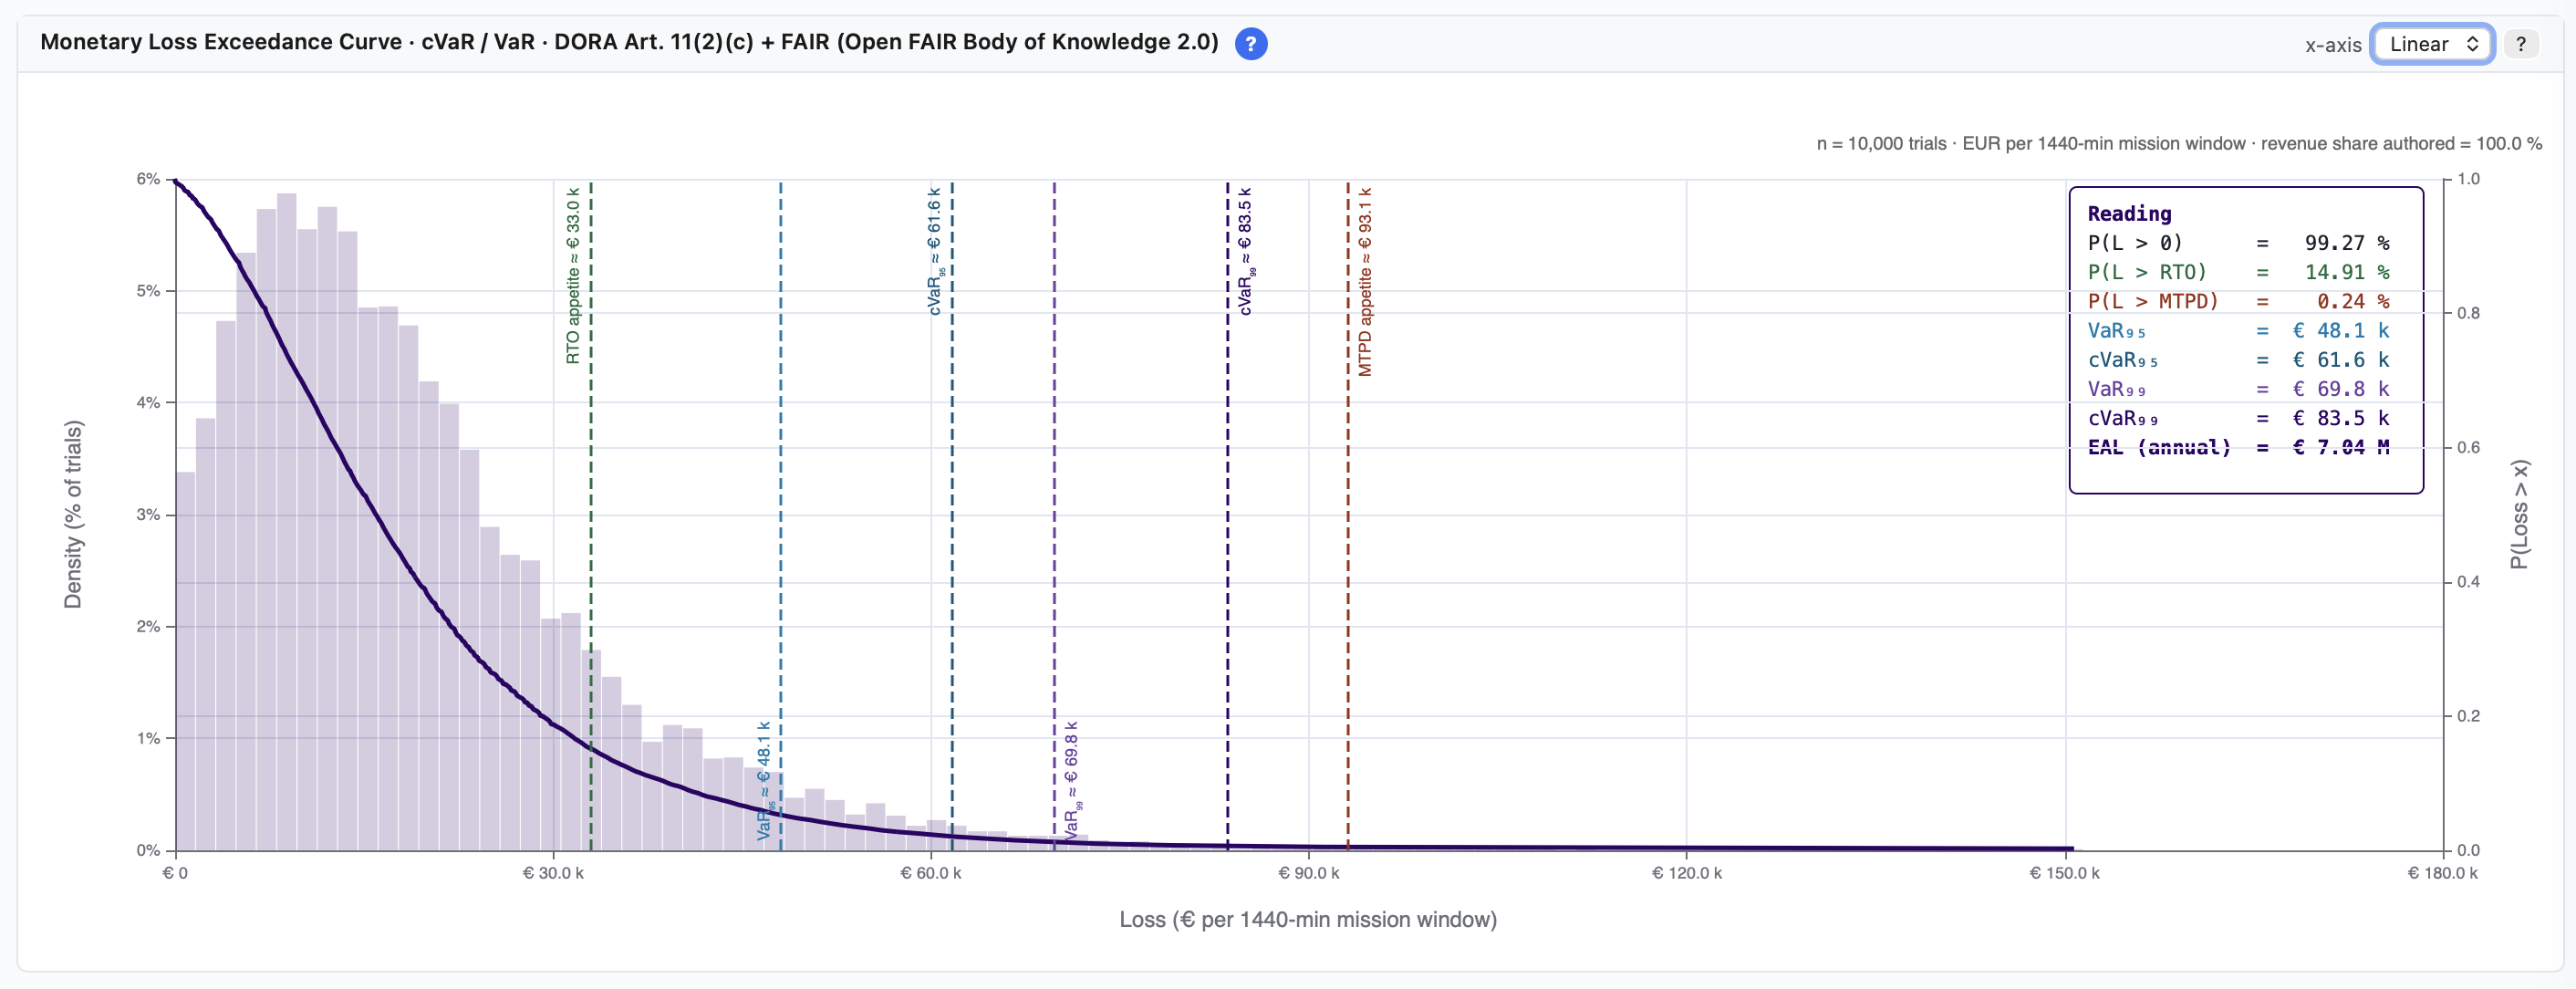
Financial loss where it matters
DORA-MAST runs disruption scenarios against your model and computes the loss-exceedance curve: the probability and size of financial impact, so the board sees a number, not a colour.
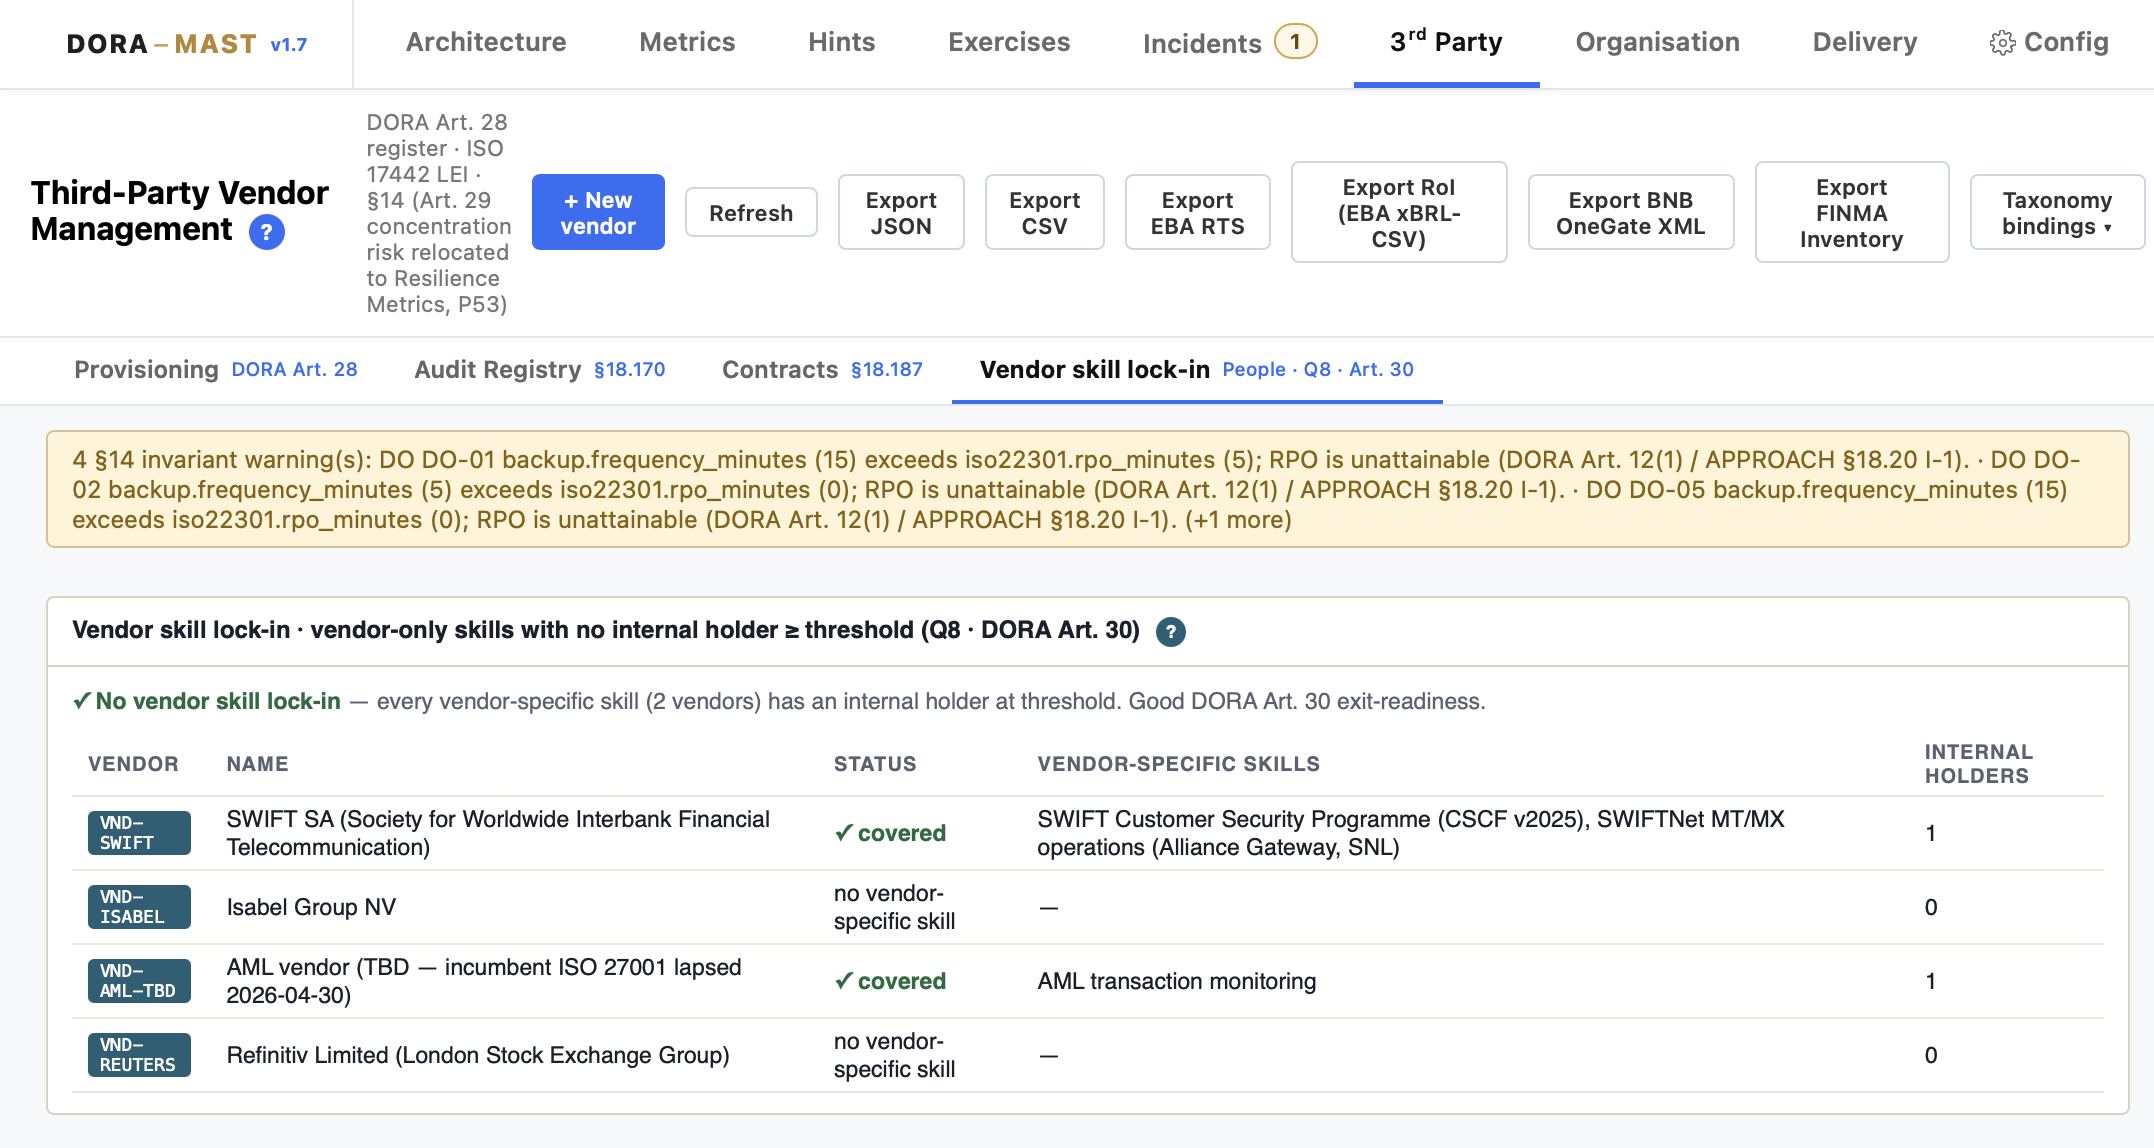
Third-party risk
Vendor skill lock-in, quantified
DORA-MAST maps your third-party ICT dependencies and quantifies the resilience impact of vendor concentration and skill lock-in. Every supplier relationship is scored against DORA Art. 28-30 requirements, giving your risk committee defensible evidence for the register.
DORA asks financial entities to prove resilience, not assert it. The regulation requires that institutions model their critical functions, identify their dependencies, simulate disruption scenarios, and quantify the financial impact of failure. Most organisations answer with spreadsheets and narrative. That is not proof.
DORA-MAST does the work the regulation actually requires. It maps your critical ICT functions and their dependency chains, runs disruption scenarios against the model, and computes financial loss figures that your board, your regulator, and your auditor can rely on.
How it fits your existing work
DORA-MAST does not replace your CMDB or your BCP. It reads from them. The model ingests your existing asset inventory and business continuity inputs, enriches them with dependency data, and runs the simulation layer on top. Your existing documentation becomes the starting point, not a parallel exercise.
Frameworks addressed
Every product is field-tested