What it does
A live, 3D, audit-ready architecture map
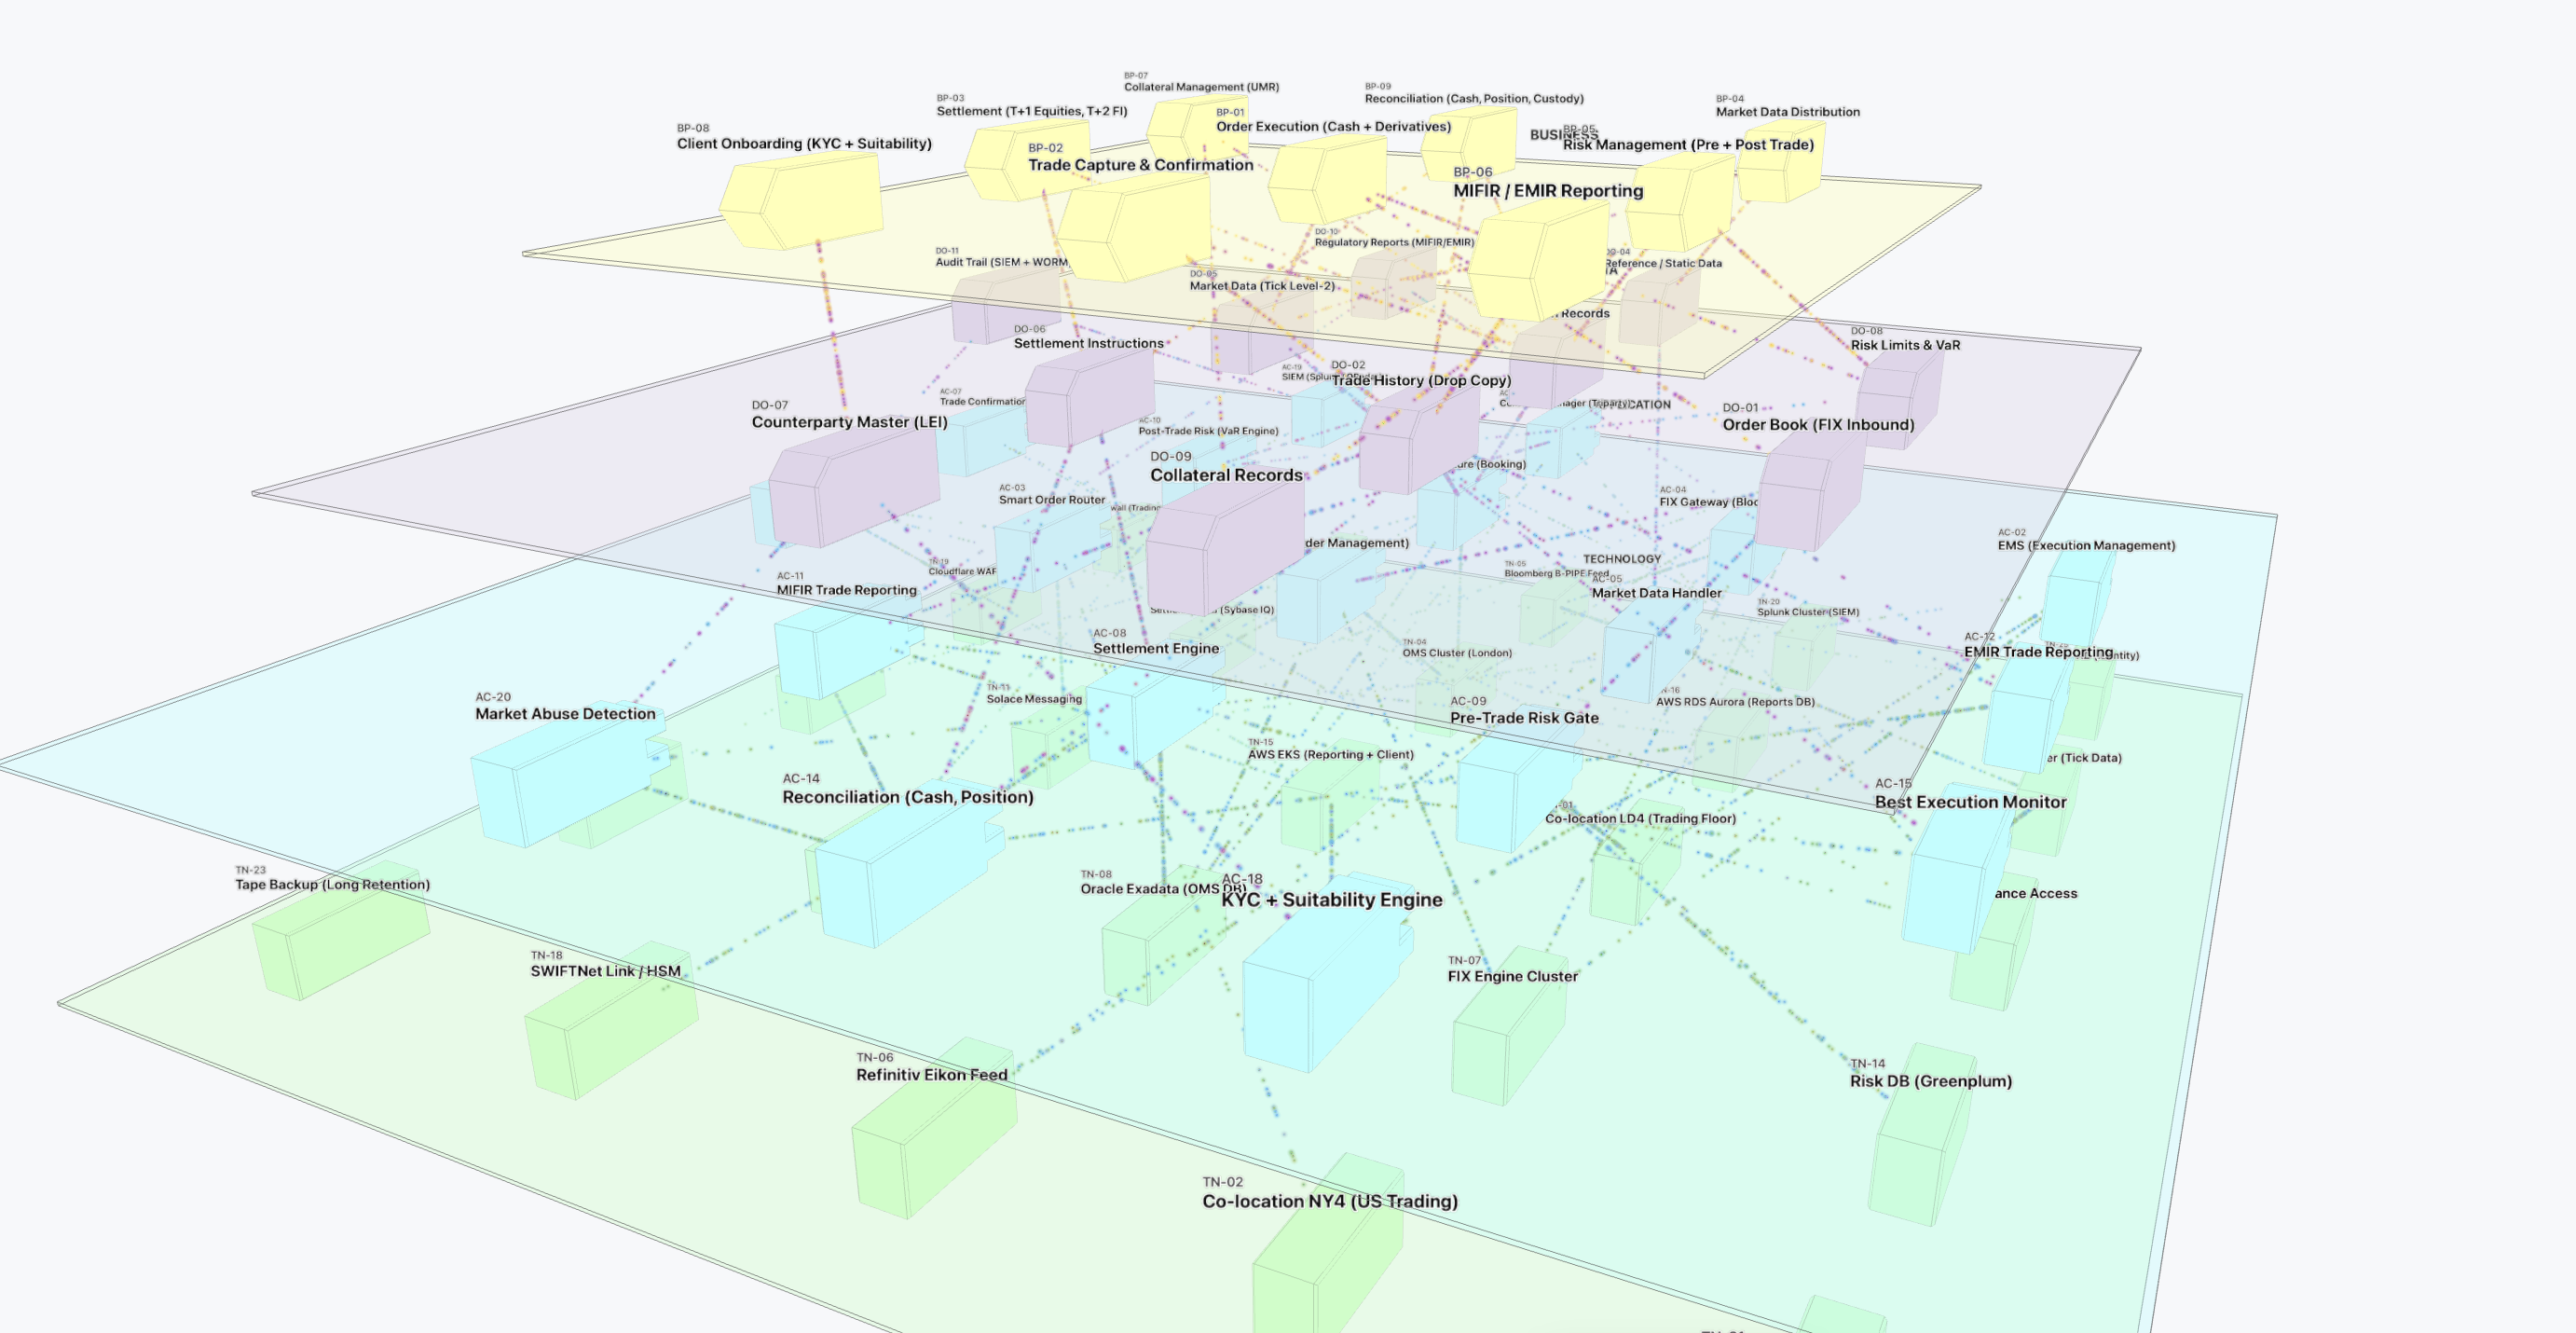
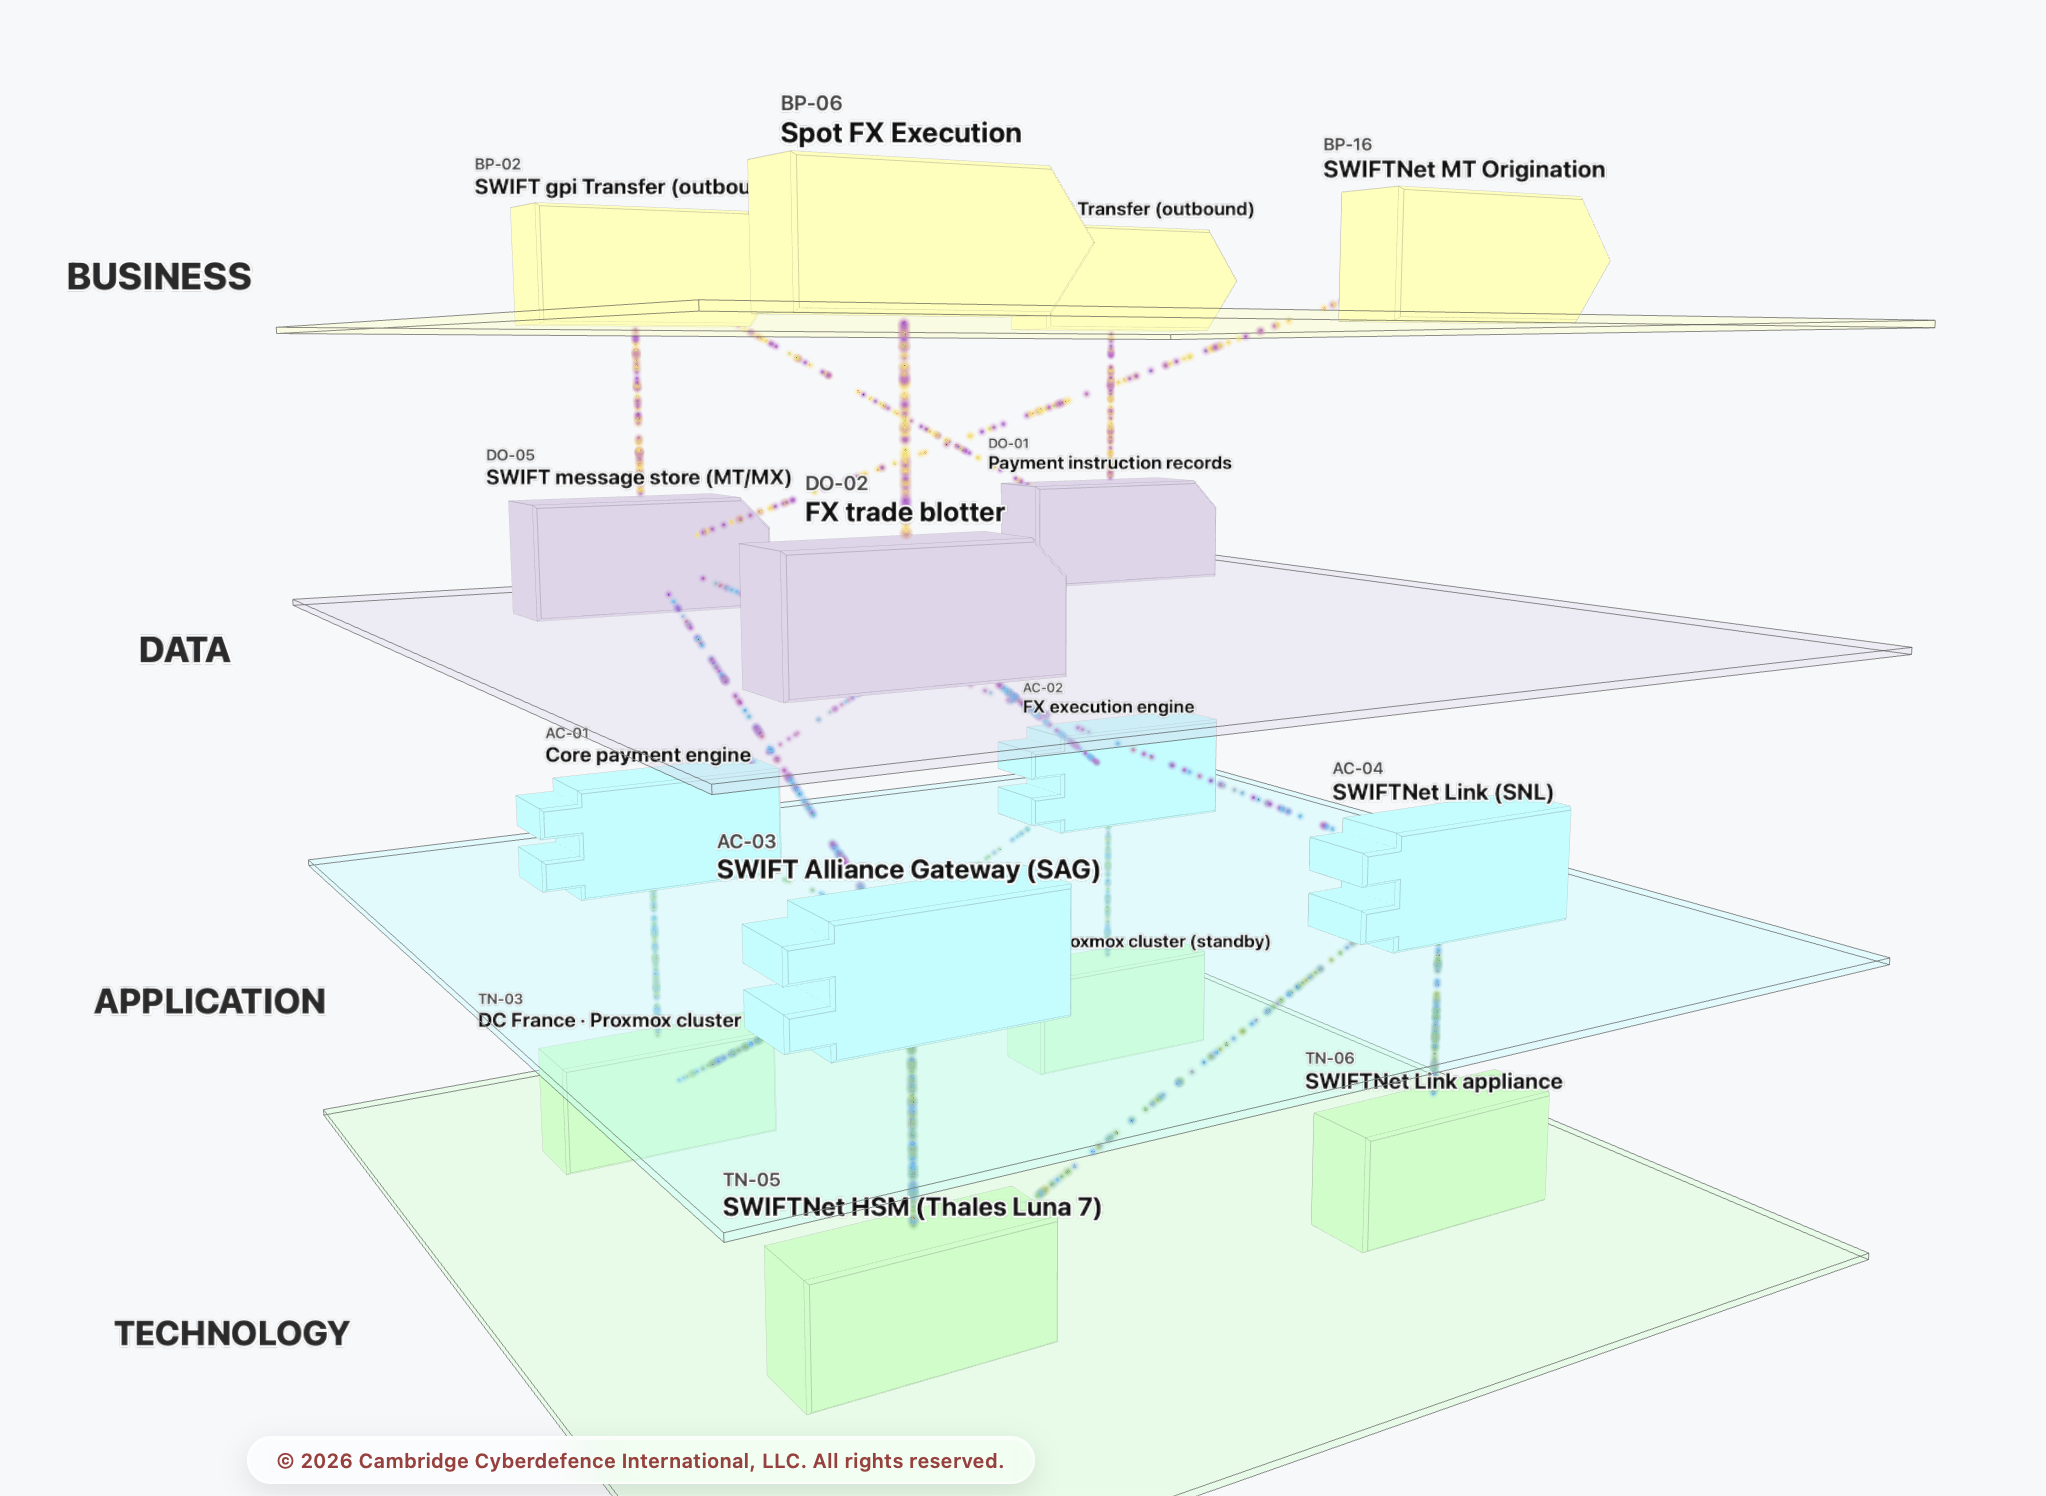
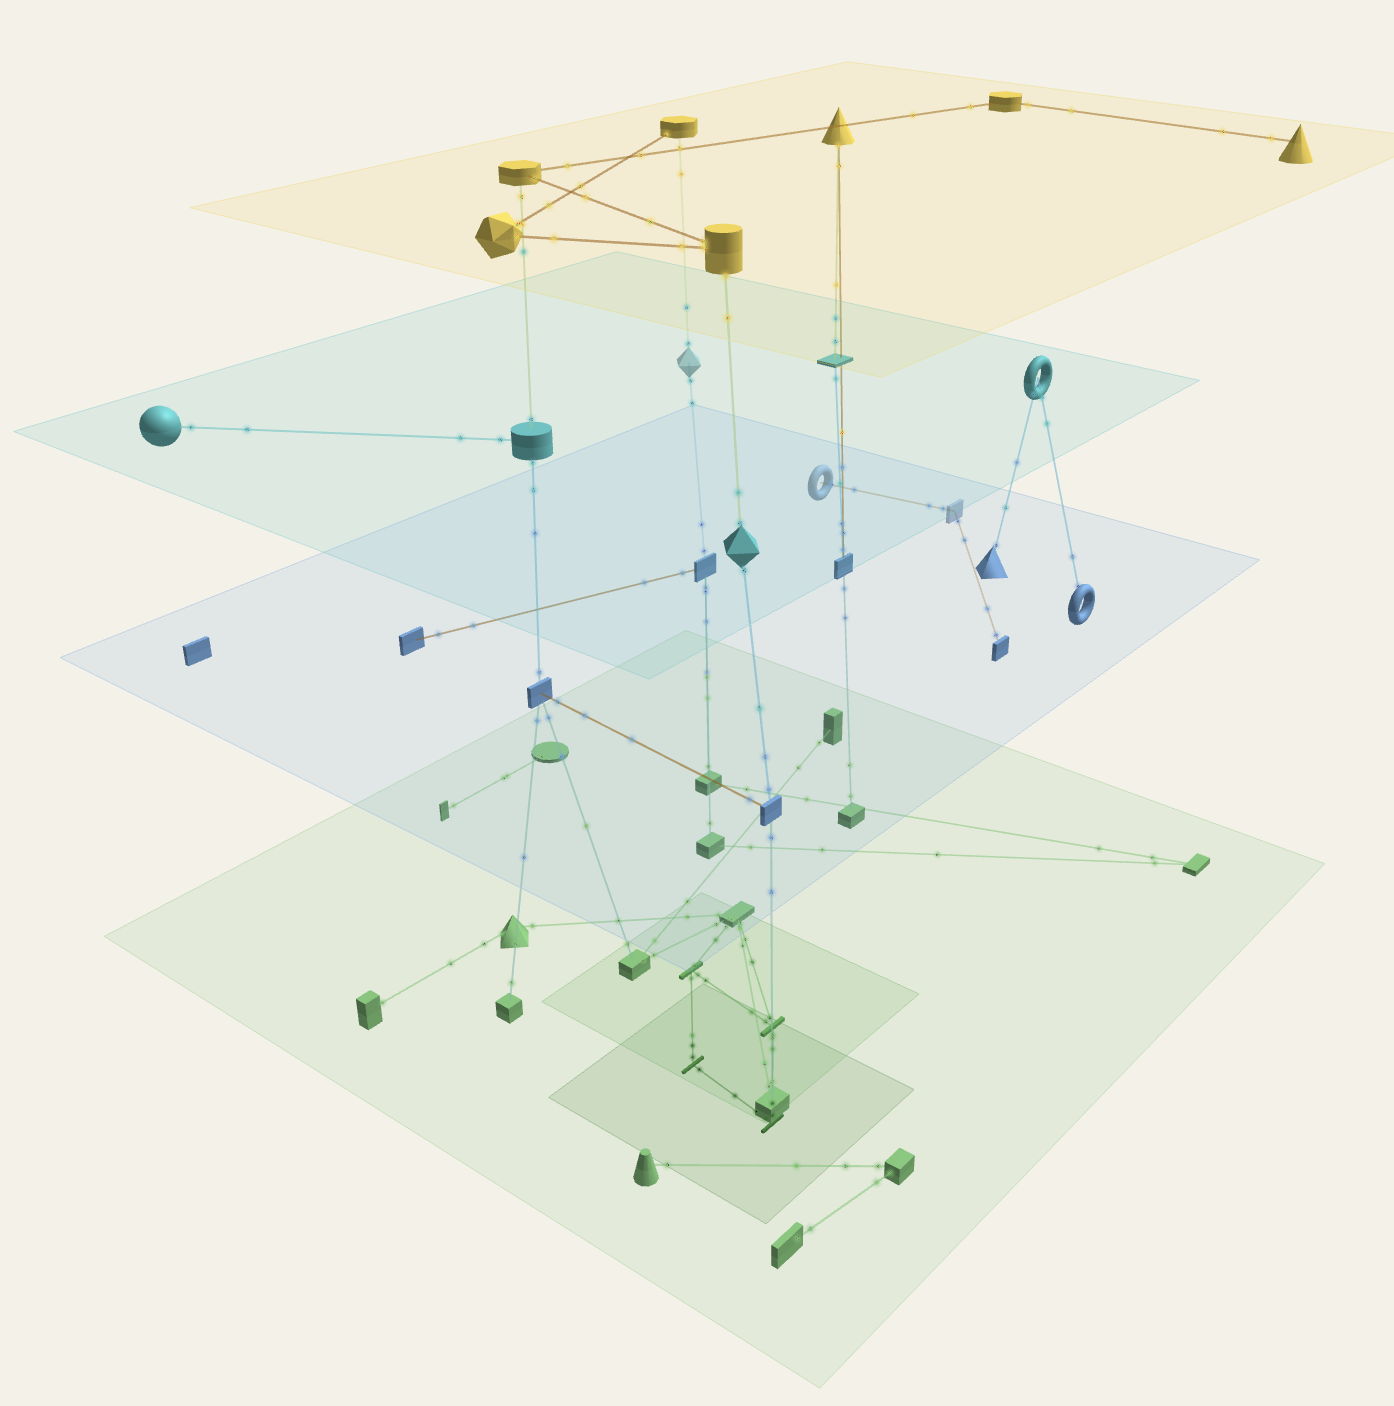
NetDiagramer reads your live inventory and renders a layered architecture graph: business processes, data objects, application components and technology nodes, with cross-layer dependencies drawn automatically from the data. It satisfies DORA Article 8, NIS 2 Article 21 and SWIFT CSP architecture documentation.
How it works
Diagrams drawn from data, not memory
NetDiagramer connects to your CMDB, network discovery agents and EviGen output. It maps firewall zones, cloud and on-premise assets, and cross-layer dependencies automatically — no manual drawing, no stale screenshots.
Audit-ready output
From architecture graph to compliance evidence
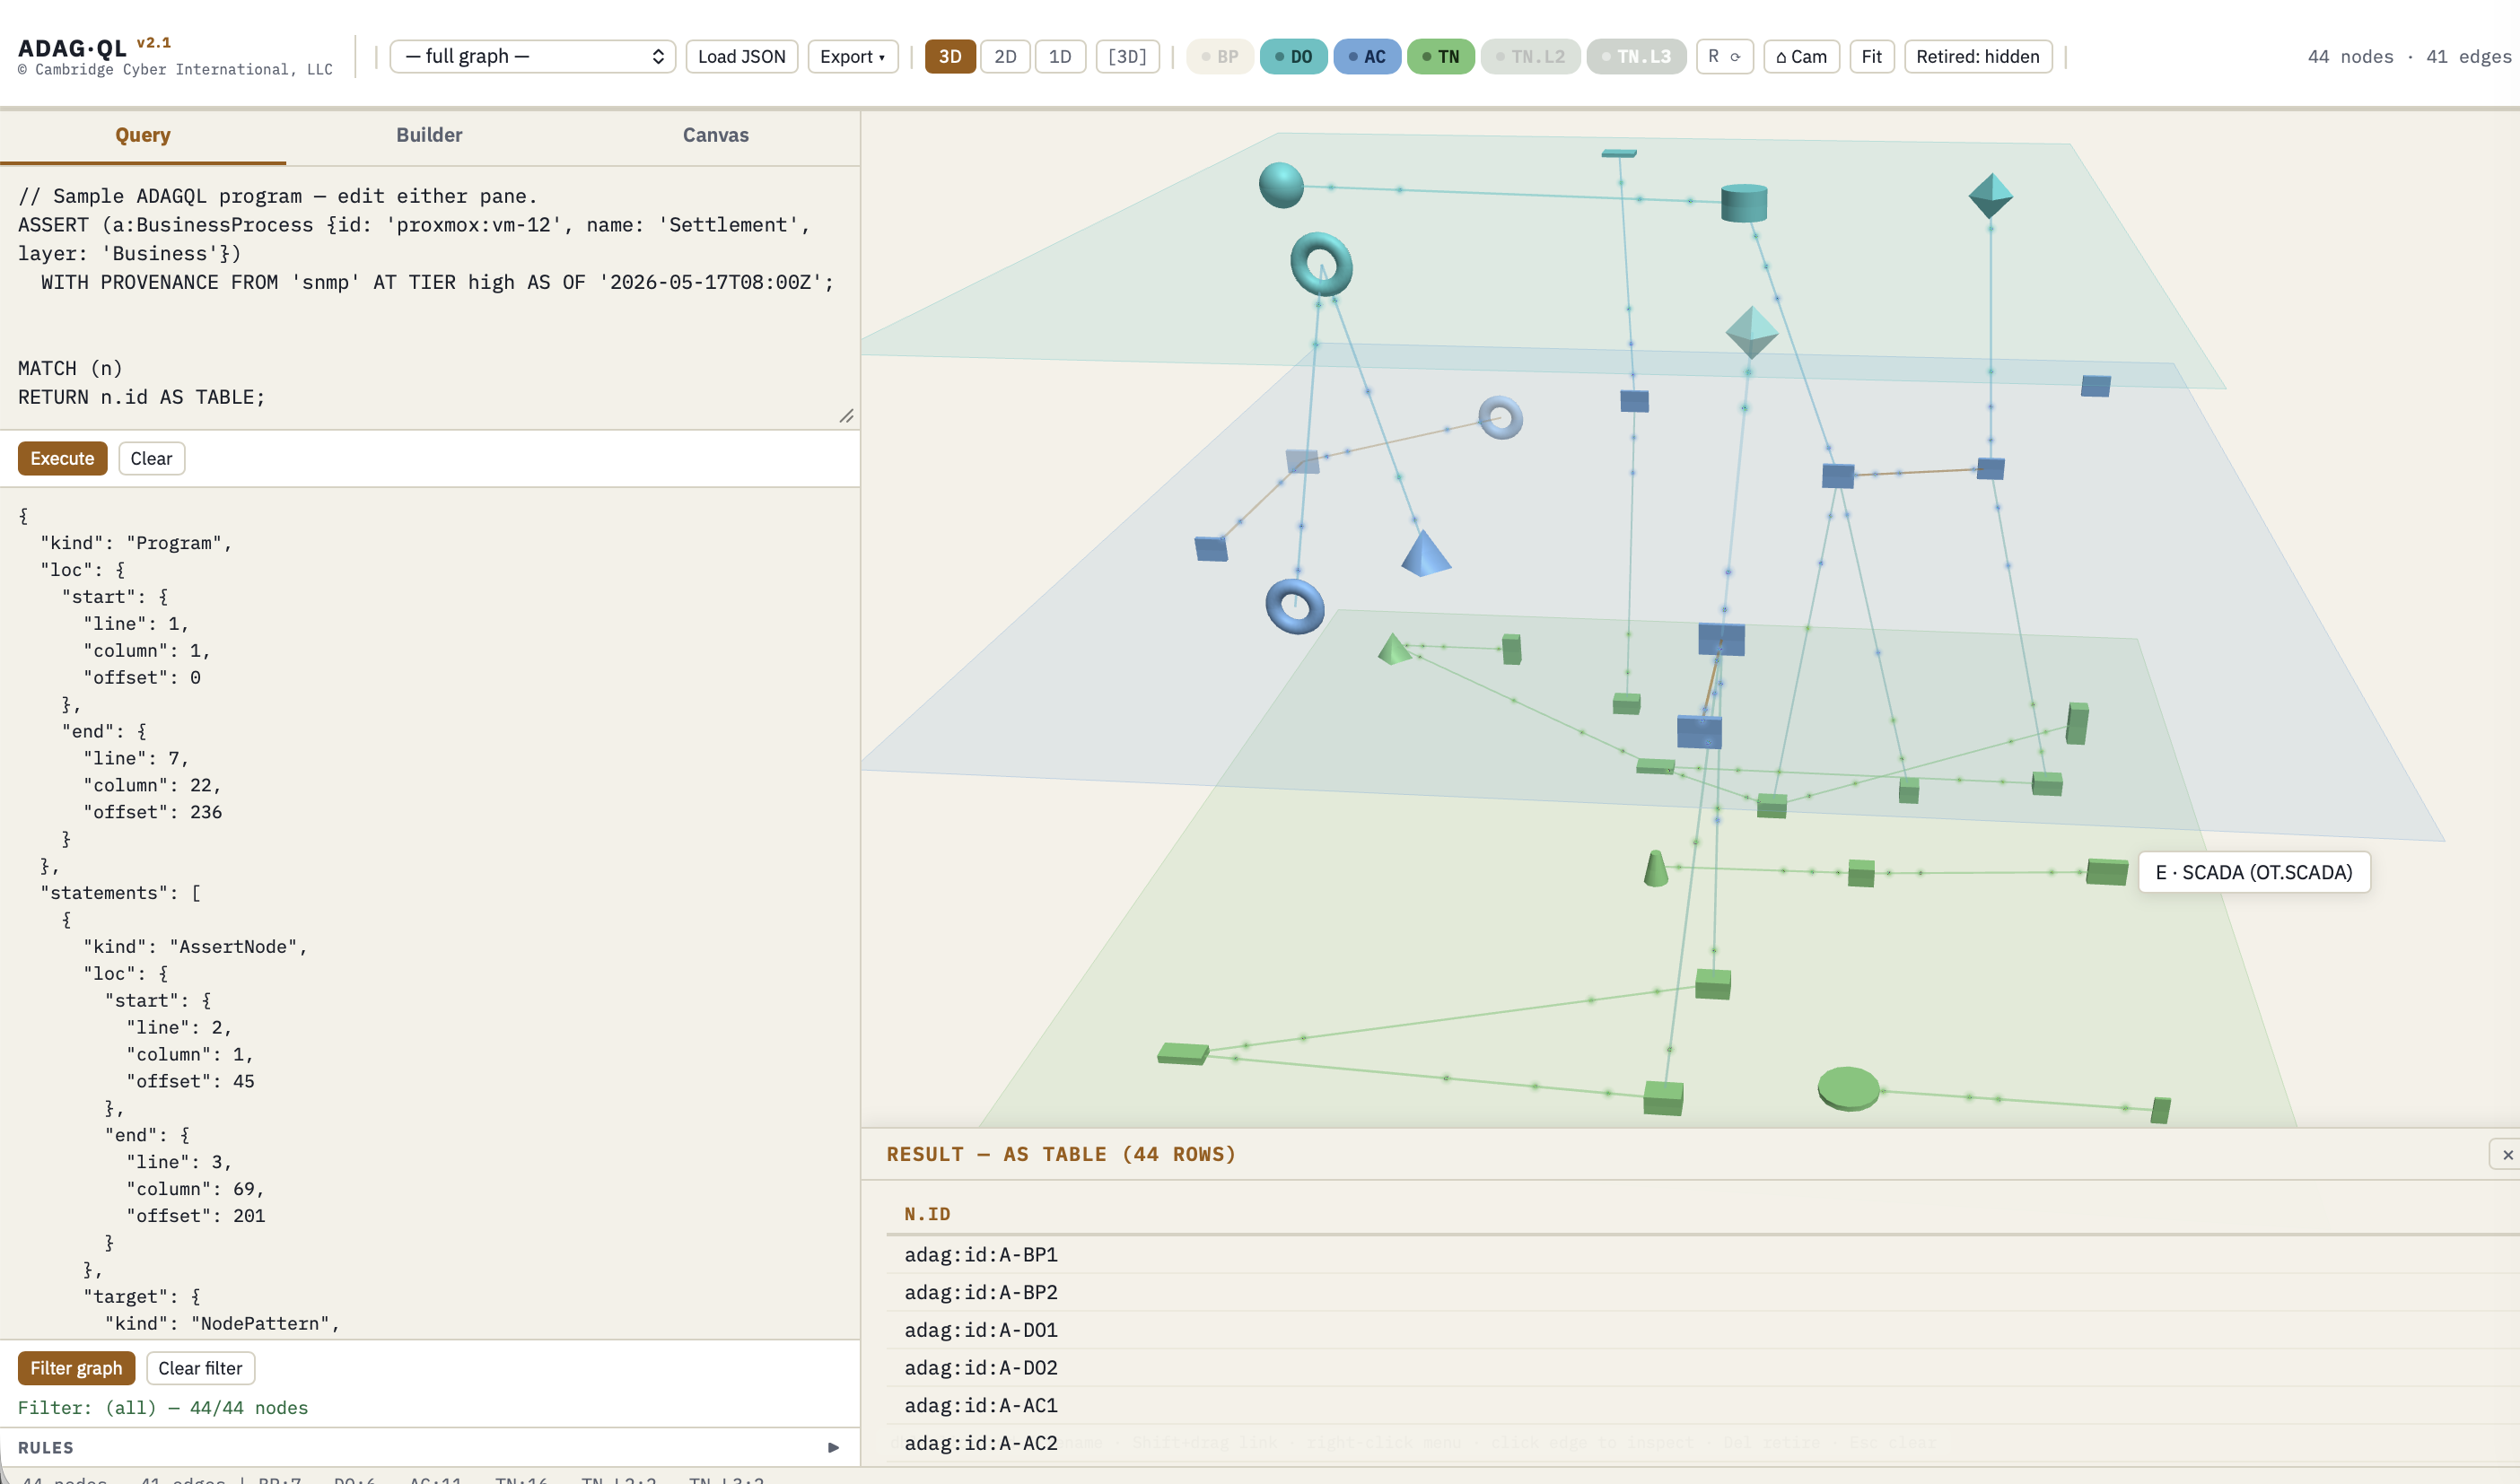
Every graph is exportable as structured JSON, PDF, or SBOM. DORA Article 8 evidence packages include layer-by-layer dependency maps, change history, and risk-owner sign-off. One export satisfies your internal audit, your regulator, and your ISO 27001 certification body.
The problem with network diagrams
Every network diagram is wrong. Not because the engineer drew it badly, but because infrastructure changes the moment the diagram is saved. Auditors rely on diagrams that are months out of date. DORA Article 8 requires financial entities to maintain a complete and accurate map of their ICT assets and dependencies — and most cannot.
Why 3D layering matters
A flat diagram conflates business logic with network topology. The four-layer stacking — Business / Data / Application / Technology — maps directly to the DORA Article 3 ICT asset taxonomy and to the FAIR threat model used in our cVaR product. An auditor reviewing DORA RTS compliance sees each layer independently; a risk analyst sees the full dependency chain vertically. The same graph serves both.
Frameworks addressed
Every product is field-tested